Bookings
$2.41M
+18.6%90d closed won

Import, manage, clean, and schedule
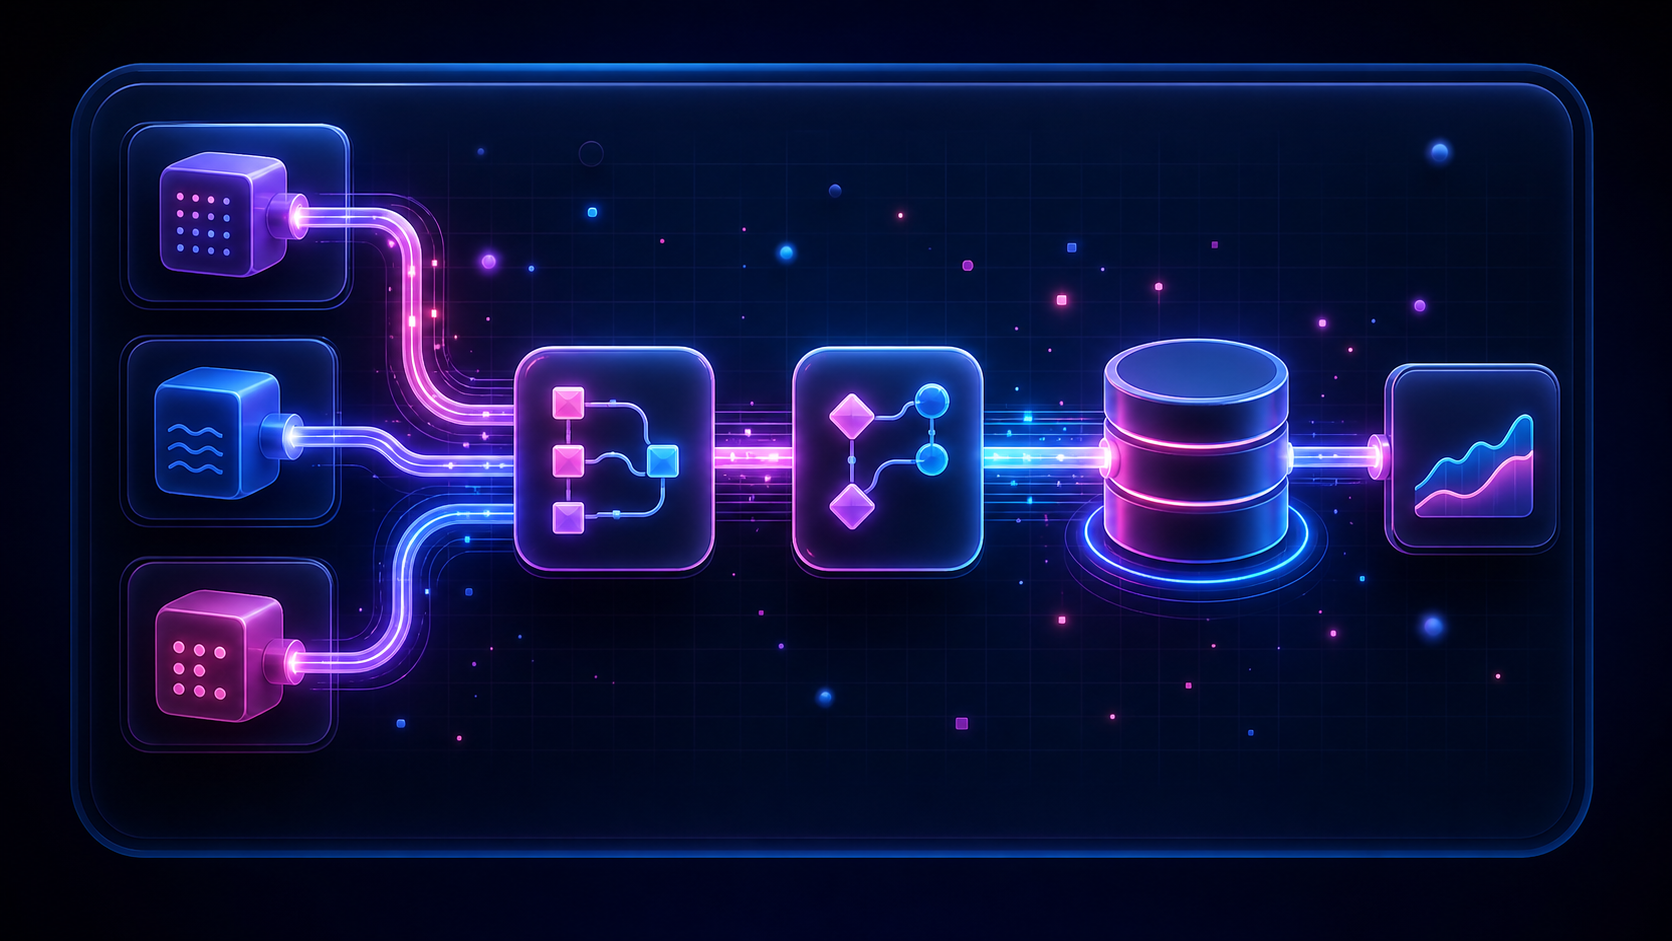 Data Pipelines visual
Publish live KPI views
 Dashboards visual
Explore cohorts and signals
 Data Science visual
Business memory reused by MCP answers and future tasks.
 DataUnmess Memory visual
Ingest from any source: GA4, files, APIs, SaaS, databases, and warehouses. Enrich, clean, transform, schedule it.
Keep saved connections current with edit, test, reconnect, and disconnect controls.
Ask your AI for a complete sales view. DataUnmess turns the request into live KPIs, charts, funnel stages, deals, and analysis.
Dashboard topics
DataUnmess turns your data into visual insights with just one prompt. Control every topic below through AI chat messages.
01
Many sources
Ask AI chat to connect Sheets, files, databases, warehouses, SaaS apps, APIs, or MCP context.
02
Live by default
Ask AI chat to refresh query-backed dashboards every 30 seconds without spending AI tokens.
03
Share dashboards
Ask AI chat to save dashboards and share them with everyone in your workspace.
04
Theme control
Ask AI chat to switch the whole dashboard across several visual themes.
05
Card controls
Ask AI chat to tune chart types, titles, fields, colors, and layout.
06
Historical analysis
Ask AI chat to compare trends, changes, and performance across time.
DataUnmess
Revenue Ops Workspace
Live sales KPIs, funnel health, forecast coverage, rep performance, top deals, and AI-written next actions.
Bookings
$2.41M
Pipeline Value
$8.7M
Win Rate
31.4%
Avg Deal Size
$84.2K
Stacked area
Combo
Bar Charts
Waterfall
Area
Distribution
Tabular
AI Notes
Bookings are up 18.6% vs prior 90 days, led by enterprise renewals.
Win rate improved 3.6 pp. Keep proposals under 30 days to protect velocity.
Forecasted bookings of $2.7M gives 112% coverage vs the next target.
First asks
Once DataUnmess is connected, start small: create a dashboard, build a pipeline, explore data science, or map a sales process.
See MCP onboardingStarter prompts
Simple asks